For the fifth year in a row, the sophomore D.M.D. class of the University of Florida College of Dentistry achieved a 100 percent pass rate on the National Board Dental Exam Part I. In addition, summary reports from the American Dental Association show that the college’s classes of 2009 to 2012 outperformed the national average on all parts of the National Board Dental Exam Part I.
“We couldn’t be more proud of the performance of our current and past D.M.D. students. All of the students worked intensely and focused as a group and individually to master the skills and knowledge necessary to perform so well on the exams. This also reflects highly on the skills of the faculty who take pride in ensuring the highest quality education for our D.M.D. students, as well as a commitment to excellence that shows at the national level,” said Boyd Robinson, D.D.S., M.Ed., interim dean of the college.
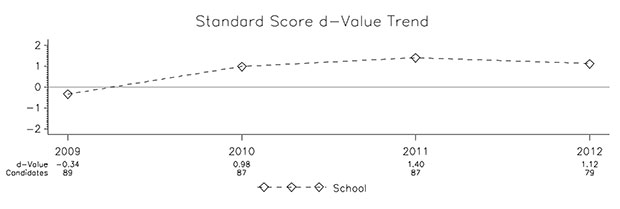
In June the college received a report from the American Dental Association with summary information on the Part I, which dental students take during their second year, showing that the UF College of Dentistry students’ standard scores were consistently better than the national average from 2009 through 2012 (see line graph below). From 2009 through 2012, UF scores were close to a standard deviation or more higher than the national averages.
“The fact that our students have consistently out-performed the national average in all five disciplines for the past five years is a huge point of pride for everyone involved in the D.M.D. education program and provides unquestionable evidence that our program is one of the best in the United States,” Robinson said.
The Class of 2015 members celebrated with a lunch hosted by the Office of Education on July 16, and attended by Teresa A. Dolan, D.D.S., who recently stepped down as dean of the college and retired from the university after 24 years on faculty.
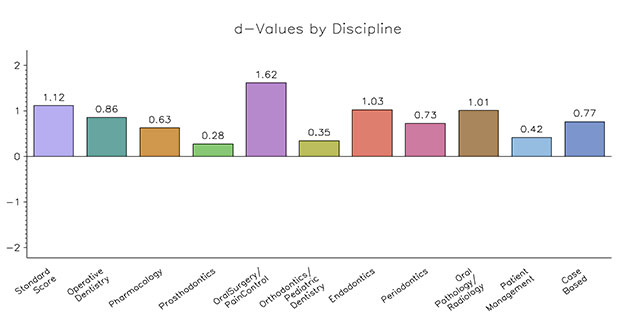
Bar chart below: The height of the bars represents UF students’ d-values for each of the disciplines and the college’s average standard score. A d-value is a standardized value representing the distance between the college’s average and the national average. This value is represented in standard deviation units.
Line graph below: The line graph indicates the college’s standard score d-values for 2009 through 2012. The number of candidates involved appears below the graph.